How to....


Setting up and using a spectrograph - Introduction
A summary document which covers, hopefully, all the practical do's and don'ts of handing and using gratings (as well as some other interesting and useful stuff) is available here. Read it through carefully. Further information is given in the various sections.
The spectroscopy page of the BAA Equipment and Techniques section available
here contains some very useful and up to date information. Well worth checking out.
Setting up gratings
Generally most amateurs start with the 1.25" filter sized transmission gratings - The Star Analyser, SA 100 or SA 200 (The eyepiece gratings from Baader and Rainbow Optics are no longer available). These can be used in front of a camera lens "Objective grating" or with the telescope optics "In the converging beam" Using the objective grating is as simple as mounting the grating on front of the camera lens. You can either modify a lens cover to hold the grating securely, or purchase a suitable adaptor which holds the grating and screws onto the front of the camera lens. Make sure the grating is aligned to present a spectral image horizontally across the chip.

The illustration shows the filter grating attached to a 1.25" T thread nosepiece, fitted to the DSLR camera lens with a combination
of the Baader T thread to M48 adaptor and a M48 to M55 KOOD filter stepping ring. (Note the wrap of elastic on the T thread - this allows the grating to be slightly rotated to bring the spectral images horizontal)
For use in the telescope as a "in the converging beam" configuration, the grating can be fitted to a 1.25" T thread adaptor and mounted directly to the DSLR camera body using an appropriate T2 to camera adaptor. Alternatively the grating can be fitted to a filter selector (or filter wheel) mounted in front of your CCD camera.


There's a copy of the Star Analyser manual available here
There's a spacing calculator for the Star Analyser grating here
Christian Buil's Star Analyser page is also informative, available here
Dr. Doug West has a interesting write-up on the resolution of a grating set-up available here
For further information on transmission gratings and their optimum set-up, spacings etc. See the Gratings section under Spectrographs
Setting up a slit spectrograph
It is assumed, if you're considering a slit spectrograph, that you have moved well beyond "Spectroscopy 101".
There are many new challenges associated with the slit spectrograph - fitment (and suitability) to the telescope, acquisition and guiding, reference lamps and wavelength calibration of the grating.
This Introductory tutorial covers the basics of setting up a slit spectroscope on your telescope, focusing, setting wavelength and guiding. Read it through carefully.
This BASS tutorial also covers the basics of setting up a slit spectroscope on your telescope, guiding, acquiring a series of spectra and processing the spectra using BASS Project. Read it through carefully. Andrew's recent BASS Tutorial (based on an ALPY instrument) is more conprehensive, very helpful and should be consulted, available here.
For further information on slit spectrographs see the Spectrographs section.
Spectral profiles, corrections and calibration
Once you have obtained your spectral image the next step is to convert it to a 1D profile (graph), calibrate it in wavelength (Angstroms) then proceed to apply instrument corrections to allow detailed comparison with other spectra (or reference spectra).
This BASS tutorial covers the basics of setting up a slit spectroscope on your telescope, guiding, acquiring a series of spectra and processing the spectra using BASS Project. Read it through carefully.
Andrew Wilson (BAA) has also prepared a detailed BASS tutorial, based on ALPY data. Very useful and can be found here
Further information is available in the Processing Spectra section.
Analysing your spectrum - what information does it contain?
To be honest, this is the most interesting, and challenging aspect of amateur spectroscopy. When you've processed your image, you end up with a 1D profile which contains more data than you can handle!
The overall shape of the spectral curve can indicate the temperature of the star (Planck curve), the prominent absorption (and sometimes emission) features are the "fingerprints" of the various elements (and sometimes molecules ) which make up the star, modified by the size, temperature and physical conditions.
Where do you start?
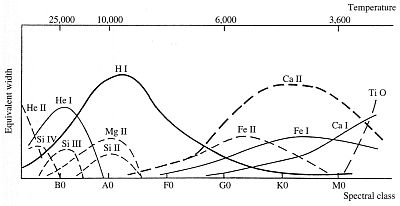
 Solution: Pick an easy target to start with! As an amateur astronomer you're probably familiar with the Spectral Classes - OBAFGKM basically covering from the hot blue stars (Class O) to the dull cool red stars (Class M). As the temperature of the star changes so to does the general composition - the hot stars (>25000 degree) have Helium and Hydrogen, the intermediate stars (~7000 degree) less Hydrogen and more metals - Calcium, Iron, Magnesium and the cool stars (<4000 degree) start to show molecular bands of Titanium Oxide and Vanadium Oxide. Knowing these elemental distributions helps to establish a starting point. Don't expect to find Titanium Oxide in a Class O,B or A spectrum; and Helium (or much residual Hydrogen) in the Class M stars.
Superimposed on every spectrum are the effects of the Earth's atmosphere. The atmospheric oxygen and water give rise to prominent Telluric absorption features. These can mask the stellar data, but can also provide some excellent reference wavelengths for calibration.
Novices are advised to start with a Class A type star - Vega, Altair, Deneb, Castor, Fomalhaut, Sirius, Bet Cen etc. (and steer away from the complex Class G or Class M). These Class A stars show relatively "clean" hydrogen absorption lines (Balmer series) which are easy to identify and use for wavelength calibration.
Once you are familiar with the "typical" spectra, then you can better appreciate the Be (emission stars), WR (again emission stars), and consider other objects like the planets (gas planets show Methane bands), Comets ( these show Swan bands of Carbon) and nebula (Oxygen and Hydrogen emissions)
Measuring the positions of the various spectral features can reveal the Doppler shift, the surrounding gas shells on some stars and the amount of the element in the stars composition (Equivalent width measurements) - and more......
Head over to the Analysing your spectrum section for more info and recommended reading.


 Solution: Pick an easy target to start with! As an amateur astronomer you're probably familiar with the Spectral Classes - OBAFGKM basically covering from the hot blue stars (Class O) to the dull cool red stars (Class M). As the temperature of the star changes so to does the general composition - the hot stars (>25000 degree) have Helium and Hydrogen, the intermediate stars (~7000 degree) less Hydrogen and more metals - Calcium, Iron, Magnesium and the cool stars (<4000 degree) start to show molecular bands of Titanium Oxide and Vanadium Oxide. Knowing these elemental distributions helps to establish a starting point. Don't expect to find Titanium Oxide in a Class O,B or A spectrum; and Helium (or much residual Hydrogen) in the Class M stars.