Analysis of Astronomical Spectra


Comparison Spectra and reference stars
By now you have managed to obtain a spectral image, used a spectral processing package to prepare a calibrated and corrected 1D fits profile and are wondering what it all means.....
I strongly recommend doing some reading....
Start with Richard Walker's excellent "Spectral Atlas", follow that with Kaler's " Stars and their spectra" and you'll have all the bases covered.
Deriving chemical composition from spectra from Michael Richmond is a great introduction to the problems/ issues of analysing starlight.
The books by Keith Robinson “Spectroscopy: The key to the stars” and "Starlight - An introduction to stellar physics” are ideal primers to start your studies of the physics behind the myriad of absorption and emission lines.
Planck Curves/ Wein's Law
The relationship between the surface temperature and the peak wavelength of the star's energy curve is given by ;
lamda(max) = 2,897,820/T where lamda is in nm, and T in Kelvin. (Wein's Law)
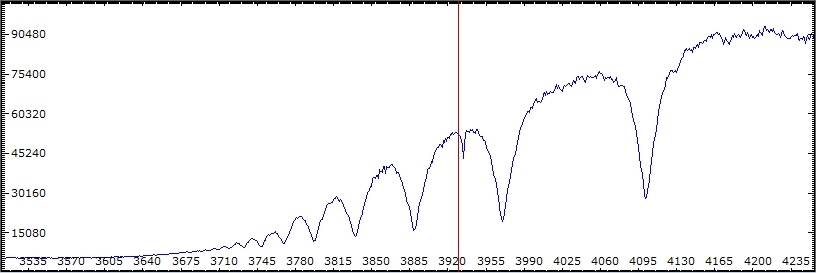
The 'Black Body" (Planck) curve then peaks at this wavelength. NOTE: this is only a theoretical concept and approximates the intensity curve of our stellar spectrum. The Balmer discontinuity and heavy absorption lines can influence the actual curve. (See Robinson's "Starlight", p 167 for the Vega spectrum "problem")
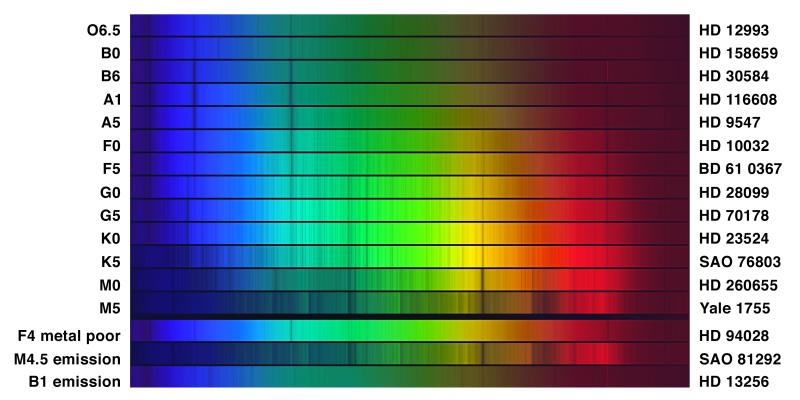
Spectral Classes gives a good overview and explains the Classification system. ( A far more detailed and explanatory reference is "Stellar Spectral Classification" - R O Gray & C J Corbally, Princeton, 2000. "The" reference book on OBAFGKM. ) Examples of the Classes can also be found in the following links Gray Spectral Atlas, MKK 1943 and FAAS
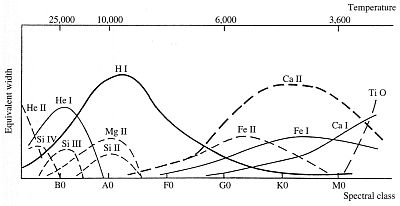
 You will quickly come across the Saha Equation (M N Saha 1893-1956) which determines the ionisation of the atoms for various temperature and pressure conditions.
It is an indispensable tool for spectral analysis, and if used wisely can provide "first guesses" at the most probably element for the absorption lines found in your spectrum. By utilising the Wein/ Planck curves an approx "Black Body" temperature for the target star can be determined and used in the Saha graph.
Atmospheric and Telluric information comes from Buil Tellurics. A good reference source for spectral analysis.
Comparison spectra data can also be found in the following:
BAA Database Useful collection (still growing) of amateur spectra, covering various astronomical objects.
ARAS Active spectroscopy group caters for all. Access portal to the ARAS and BeSS database. The regular "notes" issued by Prof. Steve Shore are a great source of up to date information.
ELODIE An on-line database of high-resolution stellar spectra.
UVES ESO stellar database
Indispensible source for spectral type and other data is the Simbad site. An amazing treasure trove of information.
NIST Provides a comprehensive spectral line listing for all the elements.
Gelato SN A must have comparison site for any SN spectral images. Defines type 1 and type 2 SN.
spectral library Comprehensive listing of many useful catalogues.